
Find the most similar historical chart patterns and see what happened next
Pattern Lab
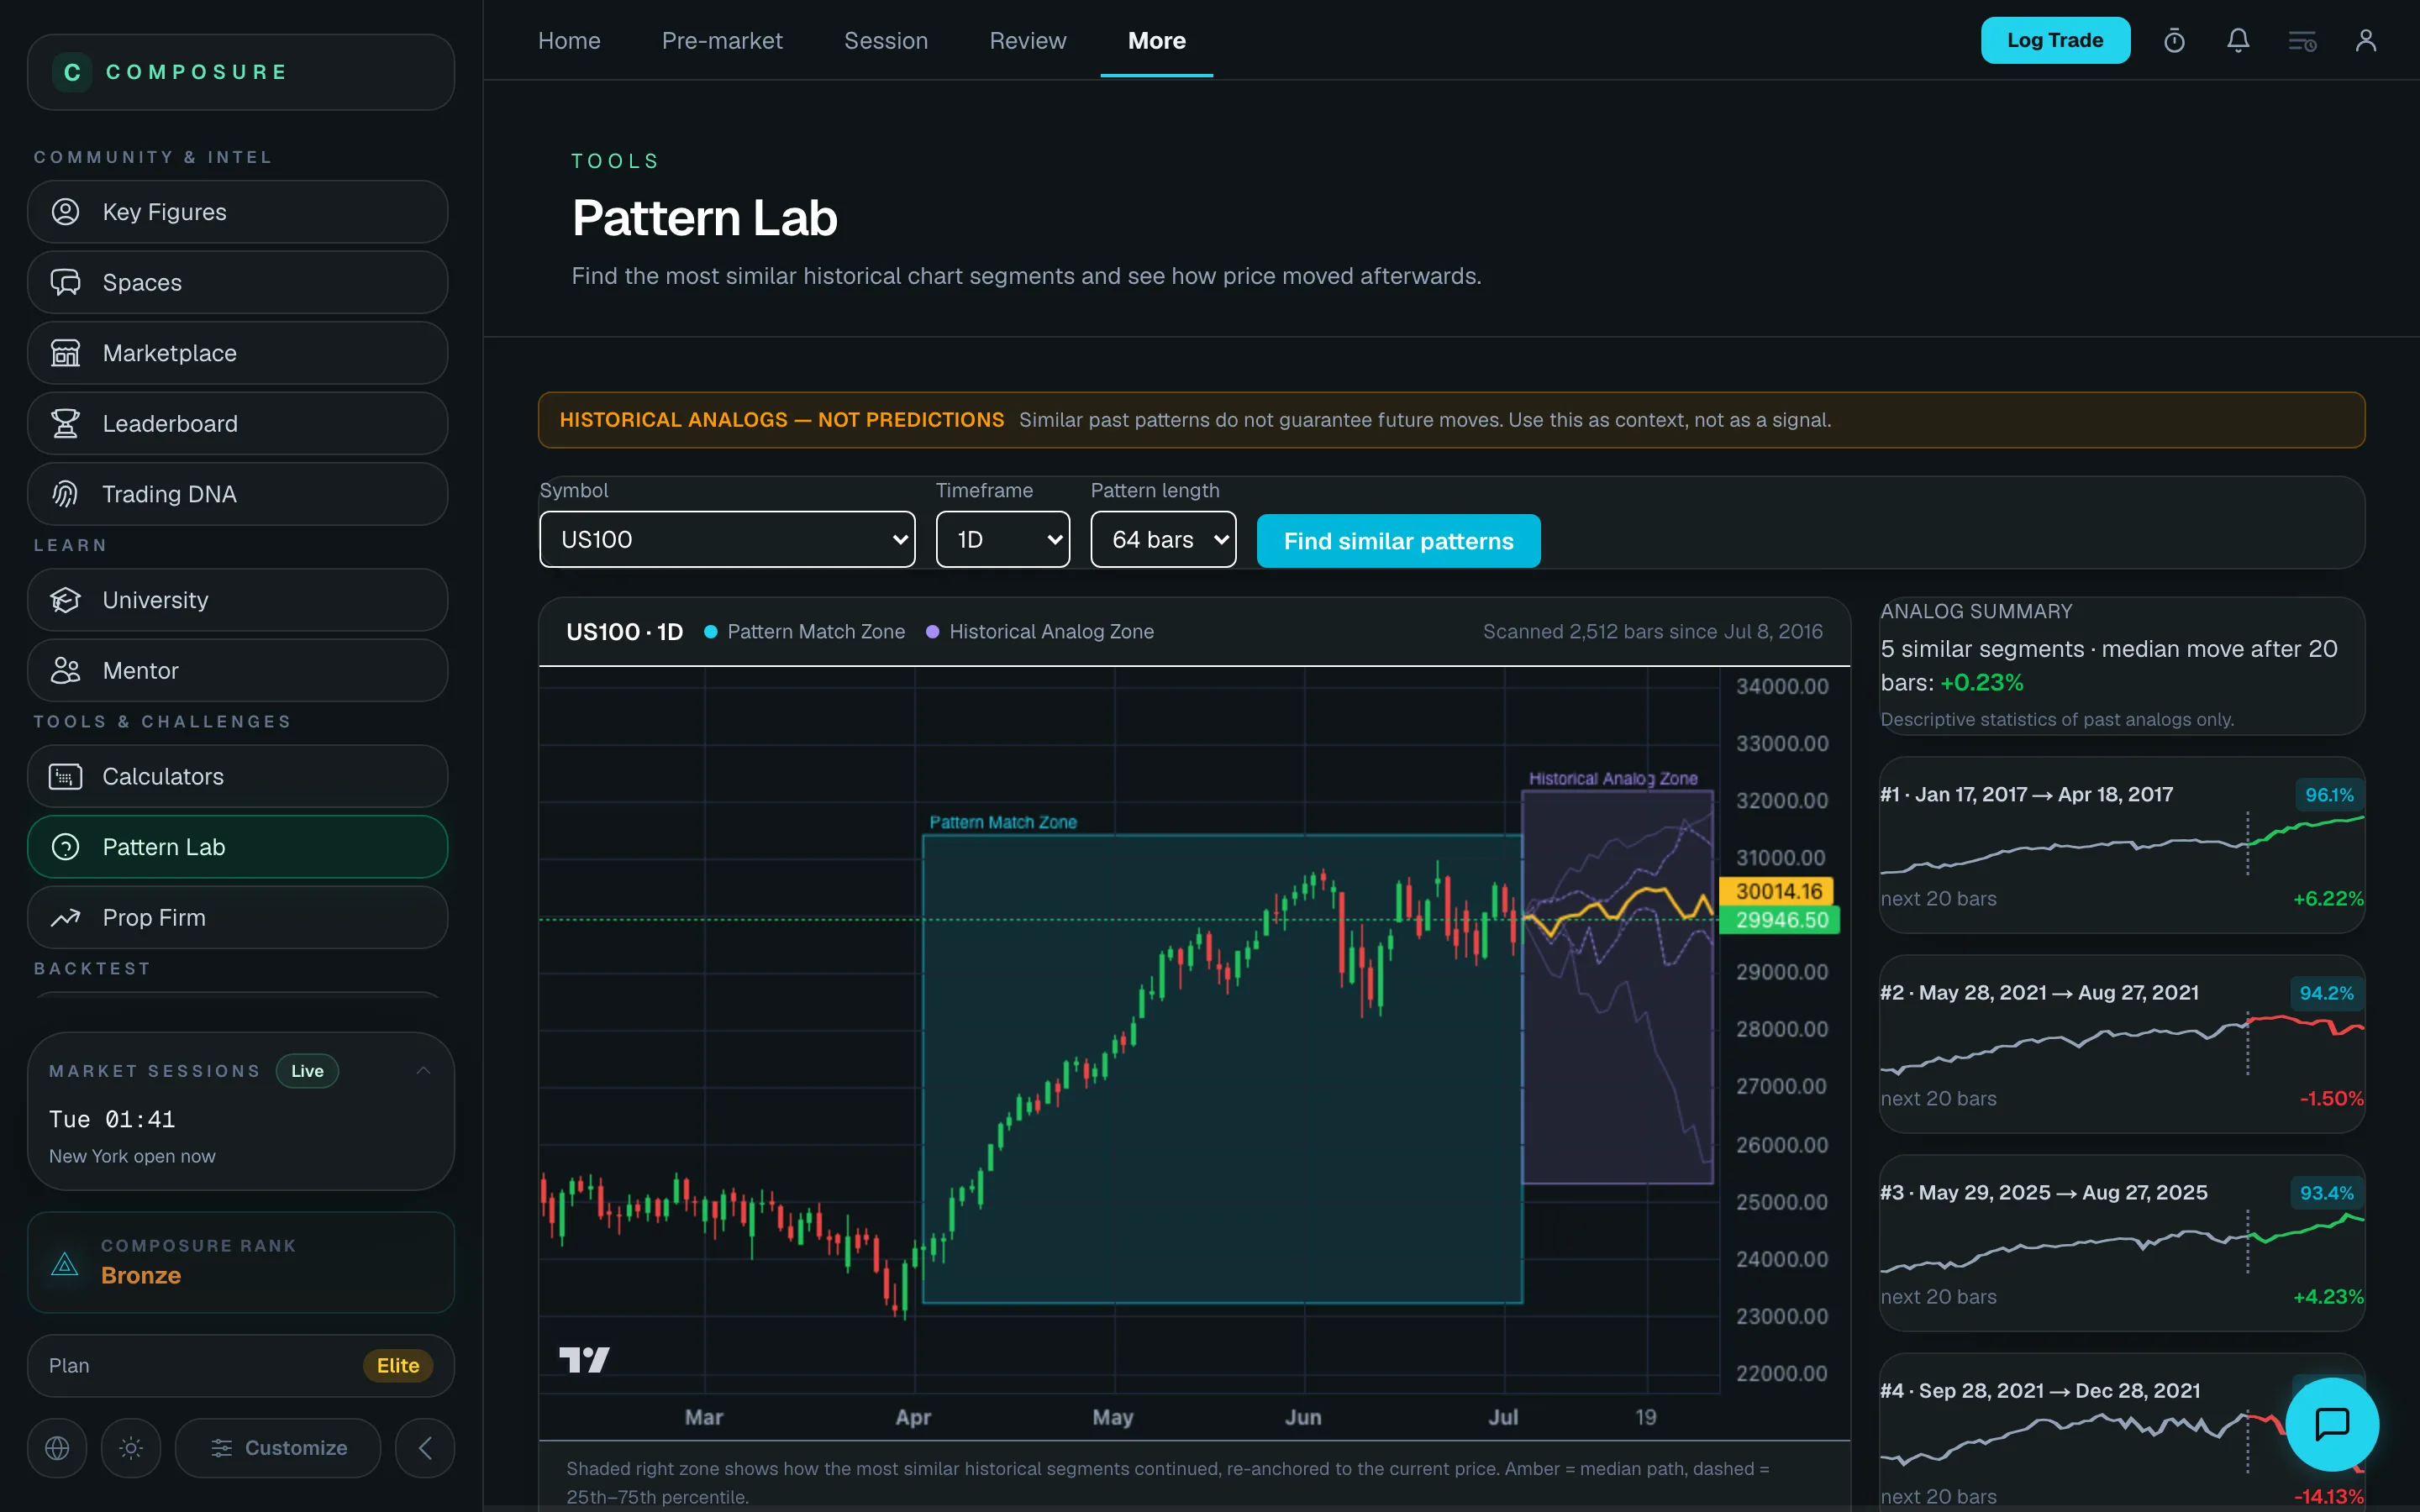
Pattern Lab scans up to 10 years of price history to find the segments most similar to the current chart — futures, forex, gold, crypto, and any US stock. It shows how each historical analog played out afterwards, re-anchored to today's price, so you get honest context instead of a prediction.
"This chart looks like 2021" is a feeling, not evidence.
Pattern Lab measures similarity mathematically (correlation on normalized prices) and shows you the actual dates and outcomes.
Pattern tools that promise predictions set you up to over-trust a single scenario.
Every result is framed as a historical analog with a median path and a percentile range — context for your plan, never a signal.
Manually scrolling back through years of charts to find a comparable setup takes hours.
One click scans thousands of bars across 15min to weekly timeframes and returns the top matches in seconds.
- Scans up to 10 years of history on 18 platform symbols plus any US stock ticker
- Three modes: match the current chart, draw a price shape by hand, or auto-detect textbook patterns (double tops, head & shoulders, triangles, wedges) with per-type historical stats
- Top 5 non-overlapping matches with similarity scores and exact dates
- Projection fan re-anchored to the current price: median path plus 25th–75th percentile band
- Honest framing built in: historical analogs, not predictions
How it works
Three steps to a calmer process
01
Pick a market
Choose a platform symbol or type any US stock ticker, then set the timeframe and pattern length.
02
Scan history
Pattern Lab z-normalizes the recent window and correlates it against every historical segment.
03
Study the analogs
Review each match's dates, similarity, and what price did next — then make your own plan.
Explore more
Works with the rest of Composure
Start journaling in the next 5 minutes
Free forever. No credit card. Your data stays private.